Lando + PhpStorm + Xdebug
PhpStorm is a popular code IDE for PHP and Drupal development.
This tutorial shows you the basics to get set up with PhpStorm and Xdebug. For a complete explaination of the Xdebug features and configuration options available to you in Lando see the Using Xdebug section of Lando's PHP plugin documentation.
Getting Started
Enable Xdebug by adding the xdebug: true line to your .lando.yml.
When using a recipe, add it under the config key:
name: mywebsite
recipe: drupal10
config:
  xdebug: 'develop,debug'
Otherwise, override your php service, usually named appserver:
name: mywebsite
services:
  appserver:
    webroot: web
    xdebug: 'develop,debug'
Out of the box, PhpStorm is already configured to connect to Xdebug. You shouldn't need to change anything, though you may refine settings to meet your needs in PhpStorm's Settings under Languages and frameworks >> PHP >> Debug.
- Install the Xdebug helper extension for your browser. For Chrome-based browsers, use the Xdebug helper extension. For Firefox, use the Xdebug Helper for Firefox add-on.
- Find the "Listen for PHP Debug Connections" button in your PhpStorm toolbar and click it to start listening for connections. The button will look like a beetle (or a phone in the classic UI).
- Add a debug breakpoint to a line in your code by clicking the line number.
- In your browser, navigate to your Lando app's URL and click the "beetle" icon that the Xdebug helper added to your address bar. Select "Debug" from the menu to tell your browser to send the appropriate parameters to Xdebug so that Xdebug activates when a request is made.
- Refresh the page or click a link. PhpStorm should now automatically open the Debug window and produce debug output if a breakpoint is reached. It may also ask you to map the application server file paths to the paths on your host machine. Lando mounts your project root to
/appin the application server, so you might map something like/users/myname/myproject/to/app.
Debugging CLI Commands
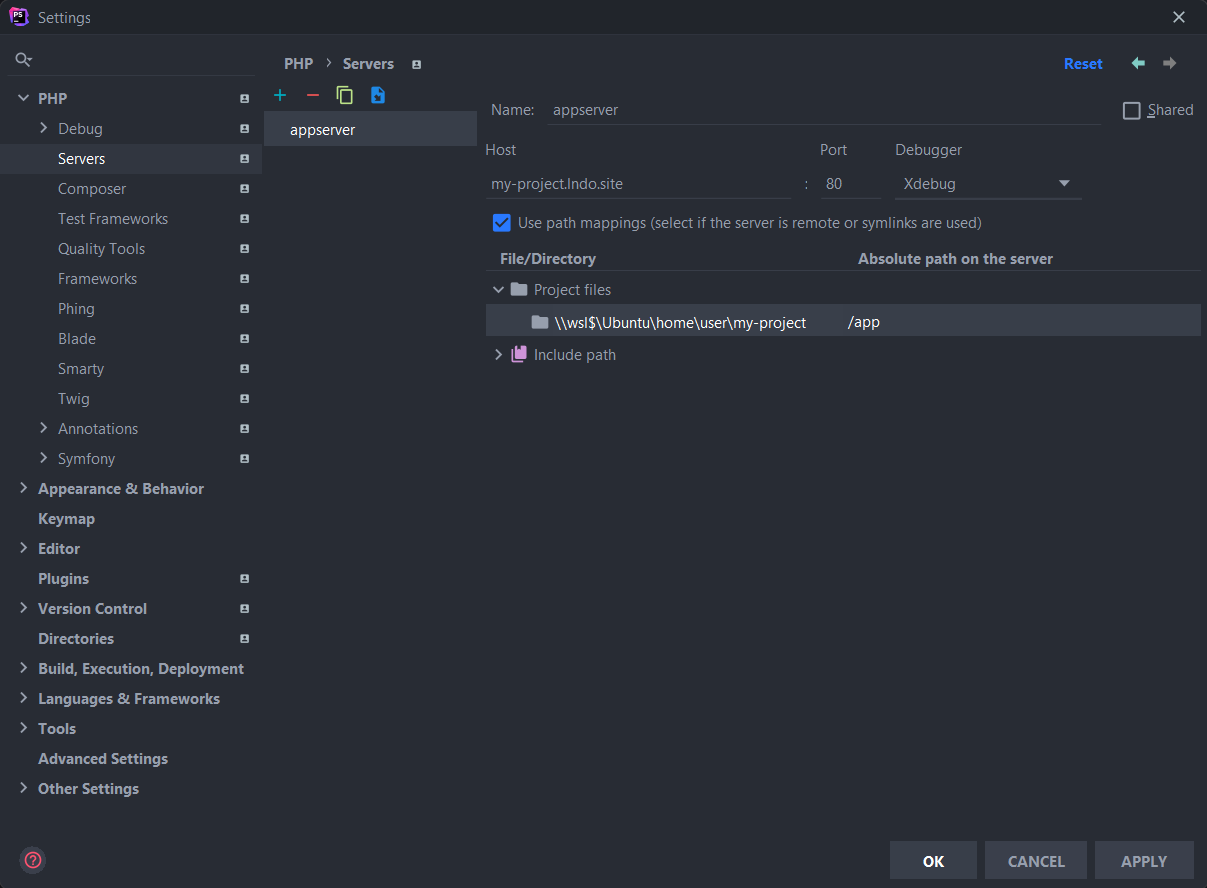
By default, our Drupal recipes come with Drush out of the box and also the Symfony recipe has a console tooling, which can be debugged with the following config. In order to debug any Drush/Symfony or CLI command using Xdebug with PhpStorm or a similar IDE, you will need to set two additional environment variables PHP_IDE_CONFIG + XDEBUG_SESSION_START and configure the path mapping in your IDE accordingly.
services:
  appserver:
    overrides:
      environment:
        # Support debugging CLI with Xdebug.
        PHP_IDE_CONFIG: "serverName=appserver"
        XDEBUG_SESSION_START: lando
You are free to assign any name to "serverName" as long as it matches the server you define in the IDE settings. In the example above we set the variable to appserver and created a path mapping for the server accordingly:

Depending on how you have configured Xdebug to be triggered (xdebug.start_with_request is off by default) you will need to tell Xdebug to start debugging the request. You can do this by either setting that global option or by setting the following environment variable before running your request:
export XDEBUG_SESSION="PHPSTORM"Toggling Xdebug
For performance reasons, it can be a negative to always have Xdebug enabled. Best option is to install/build Xdebug extension but leave Xdebug disabled (as is the case with pantheon framework with config: xdebug: false). One option to do so is to use tooling such as:
config:
  # Set Xdebug off by default. We use the tooling below to turn it on as needed.
  xdebug: false

services:
  appserver:
    overrides:
      environment:
        XDEBUG_MODE: 'debug,develop'

tooling:
  xdebug-on:
    service: appserver
    description: Enable Xdebug.
    user: root
    cmd:
      - docker-php-ext-enable xdebug && kill -USR2 $(pgrep -o php-fpm) > /dev/null || /etc/init.d/apache2 reload
      - tput setaf 2 && echo "Xdebug On" && tput sgr 0 && echo

  xdebug-off:
    service: appserver
    description: Disable Xdebug.
    user: root
    cmd:
      - rm /usr/local/etc/php/conf.d/docker-php-ext-xdebug.ini && kill -USR2 $(pgrep -o php-fpm) > /dev/null || /etc/init.d/apache2 reload
      - tput setaf 1 && echo "Xdebug Off" && tput sgr 0 && echo